
Core
GraphQL inspector
GraphQL operations are recognised by shape, with the operation name, query, variables, and errors broken out.
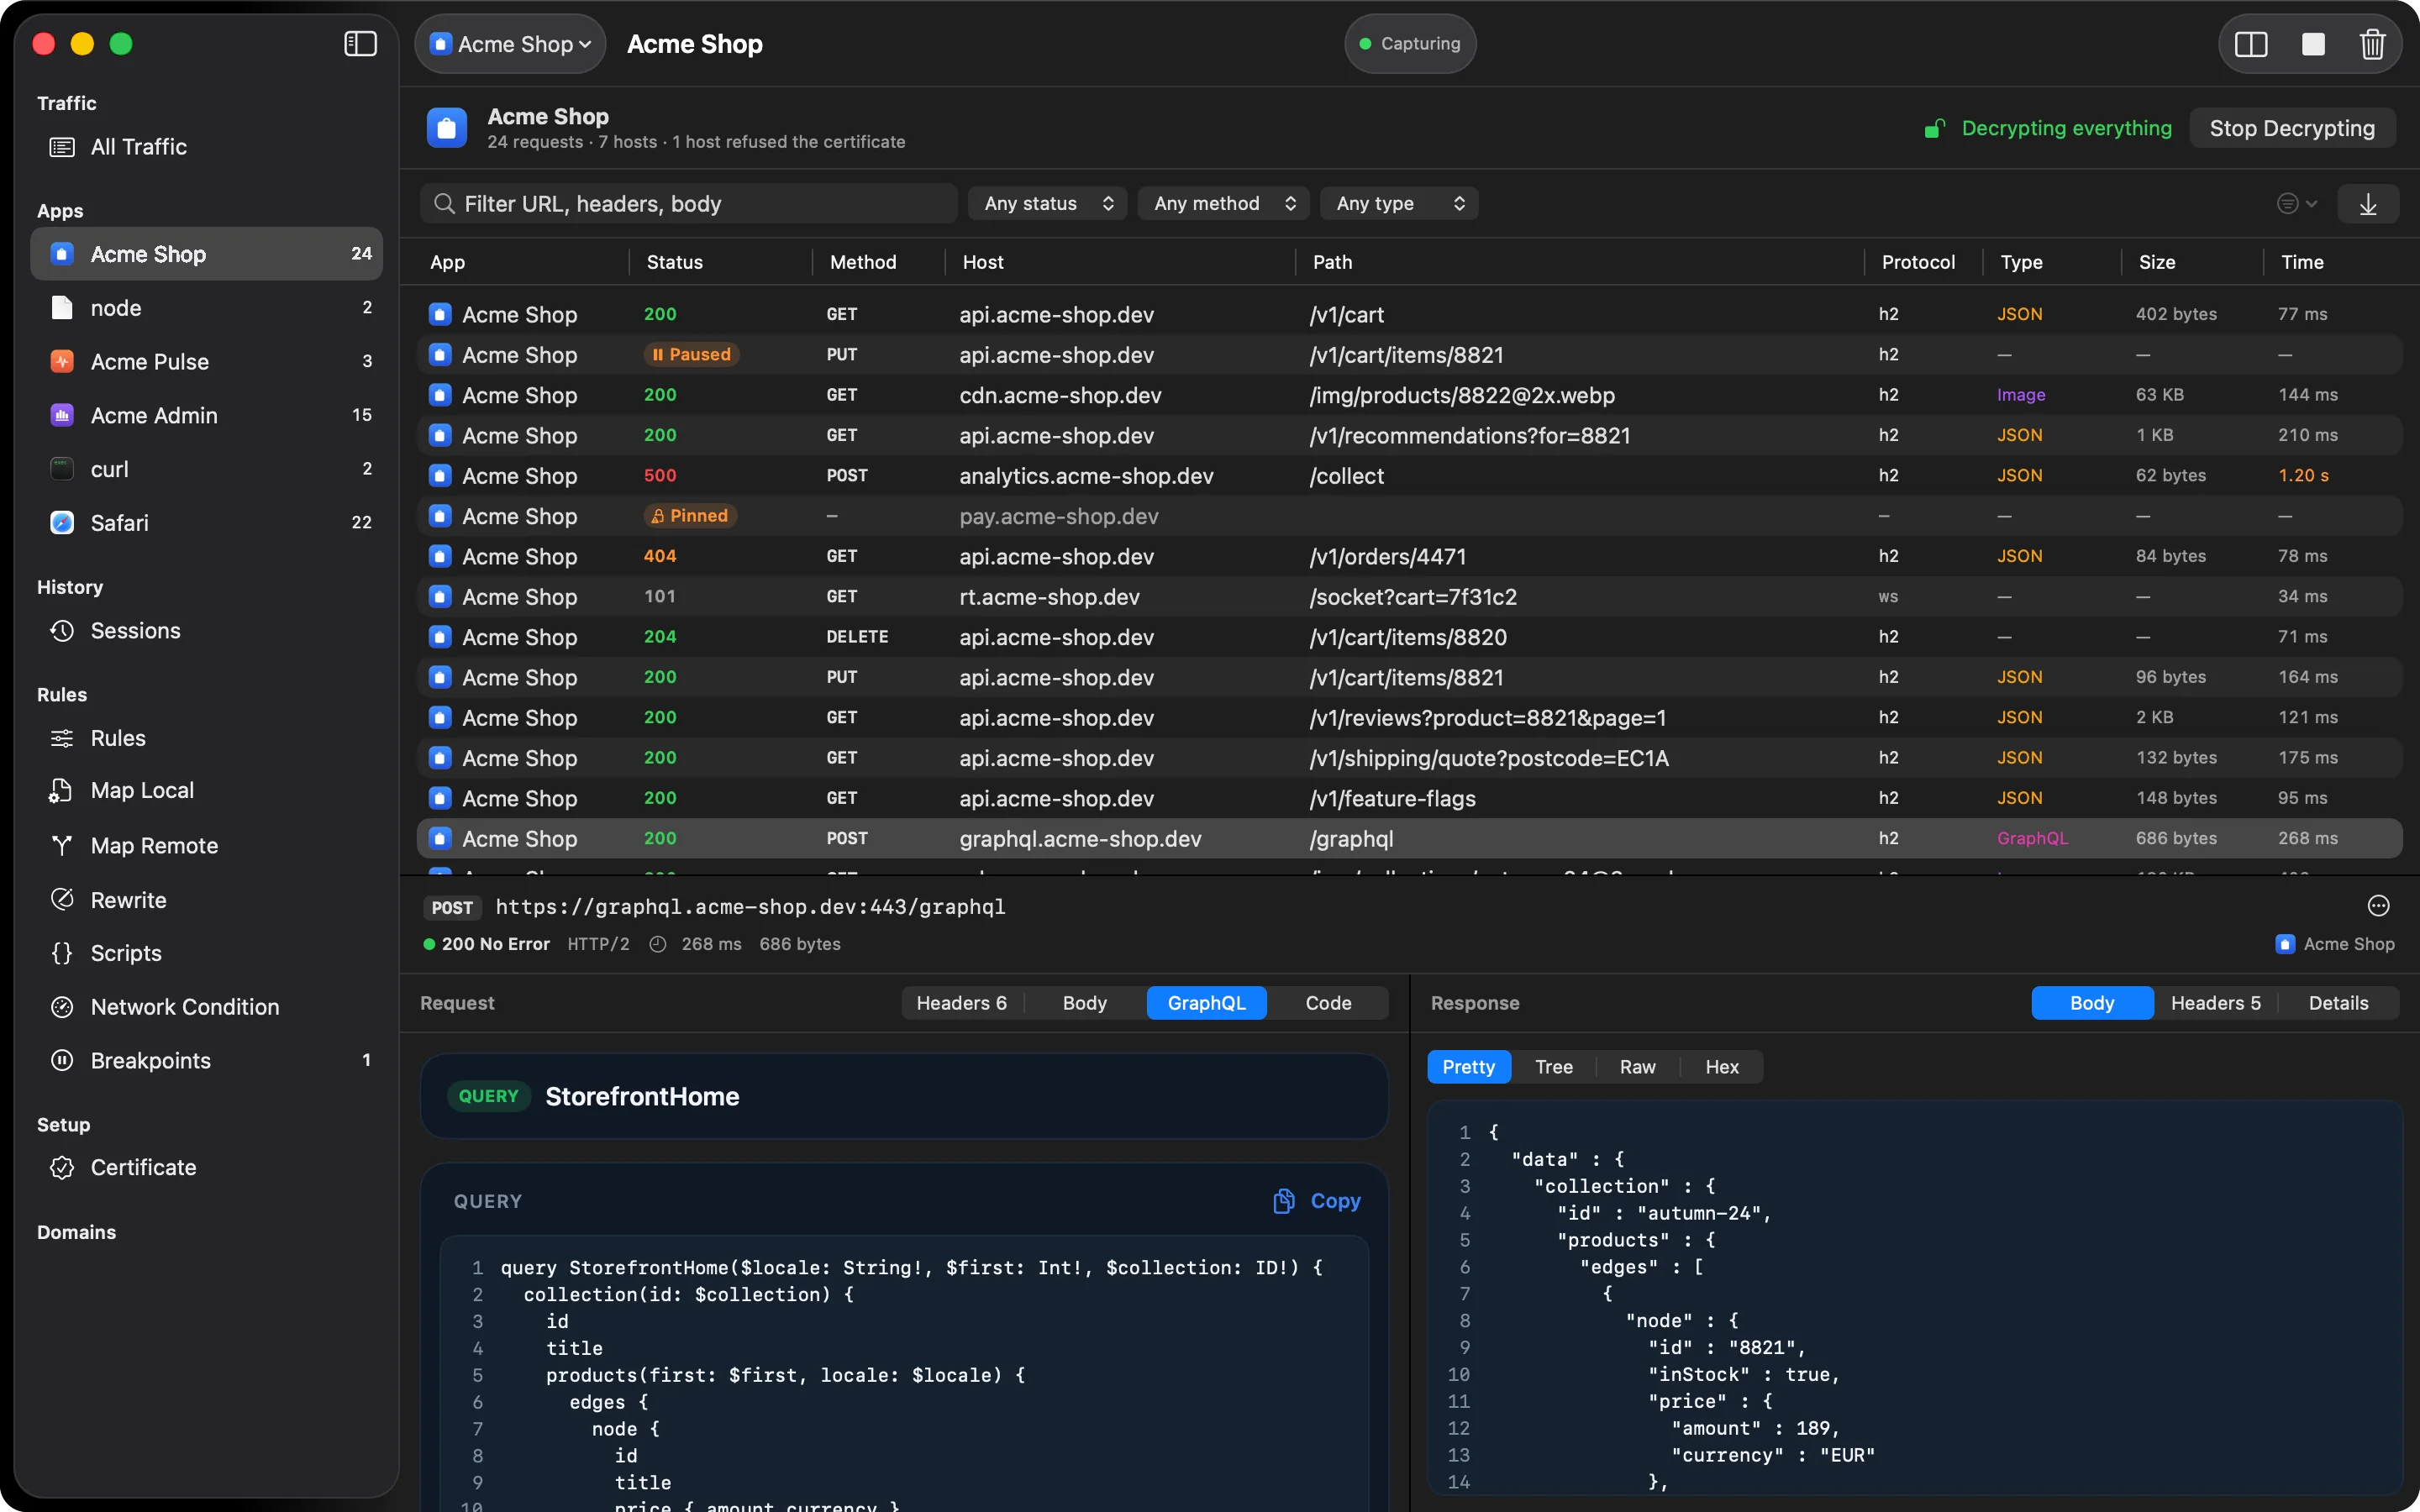
A traffic table shows every GraphQL call as the same POST /graphql, which doesn’t help when
you’re looking for one operation among dozens. HTTPGlass recognises GraphQL requests and gives
them their own tab in the inspector, and their own entry in the Type filter.
What’s detected
- Standard POST requests with
query,variables, andoperationName application/graphqlrequests where the body is the raw document- GET requests with a
?query=parameter, with a check so an unrelated?query=on a normal REST endpoint isn’t mislabelled - Batched requests (a top-level JSON array of operations)
- Persisted queries that send only a hash
graphql-wsandgraphql-transport-wssubscription messages on a WebSocket
What you’ll see
The GraphQL tab shows the operation type and name, then the query, variables, and extensions as separate blocks. GraphQL errors from the response are listed with their path and location, even when the HTTP status is a plain 200, which is how most GraphQL servers report them.
How it works
HTTPGlass looks at the shape of each request, not the URL, so it doesn’t matter whether your
endpoint is /graphql, /api, or something else. A request that matches one of the forms above
gets a GraphQL tab on the request side of the inspector, next to Headers, Query, Body, and
Cookies. As with every tab, it only appears when there’s something in it.
The same detection feeds the Type filter in the filter bar, next to JSON, form, JS, CSS, image, and document. Pick GraphQL there and the table shows only GraphQL calls.
A typical debugging session
A screen shows an empty list, and the network looks fine because everything returned 200.
- Start capturing and load the screen.
- Set the Type filter to GraphQL, so the dozens of identical
POST /graphqlrows shrink to the operations. - Search for the operation name you expect, then select the row.
- Open the GraphQL tab. Check the variables first, for a wrong ID or a missing argument, then the query itself.
- Scroll to the errors. If the server reported a problem, it’s listed with its path and location, even though the HTTP status was 200.
What it can’t do
- Only GraphQL that goes through HTTPGlass is visible, so the host has to be decrypted. See HTTPS decryption.
- Apps that pin their certificates can’t be read by any proxy. See What HTTPGlass can’t see.
Free and Pro
The GraphQL inspector is included in Free, along with the WebSocket inspector and the body viewers. See Free vs Pro.
Related
Also on iPhone & iPad:Get it on the App Store