
Core
Filters and search
Narrow a busy traffic table by status, method, or content type, or search URLs, headers, and bodies directly.
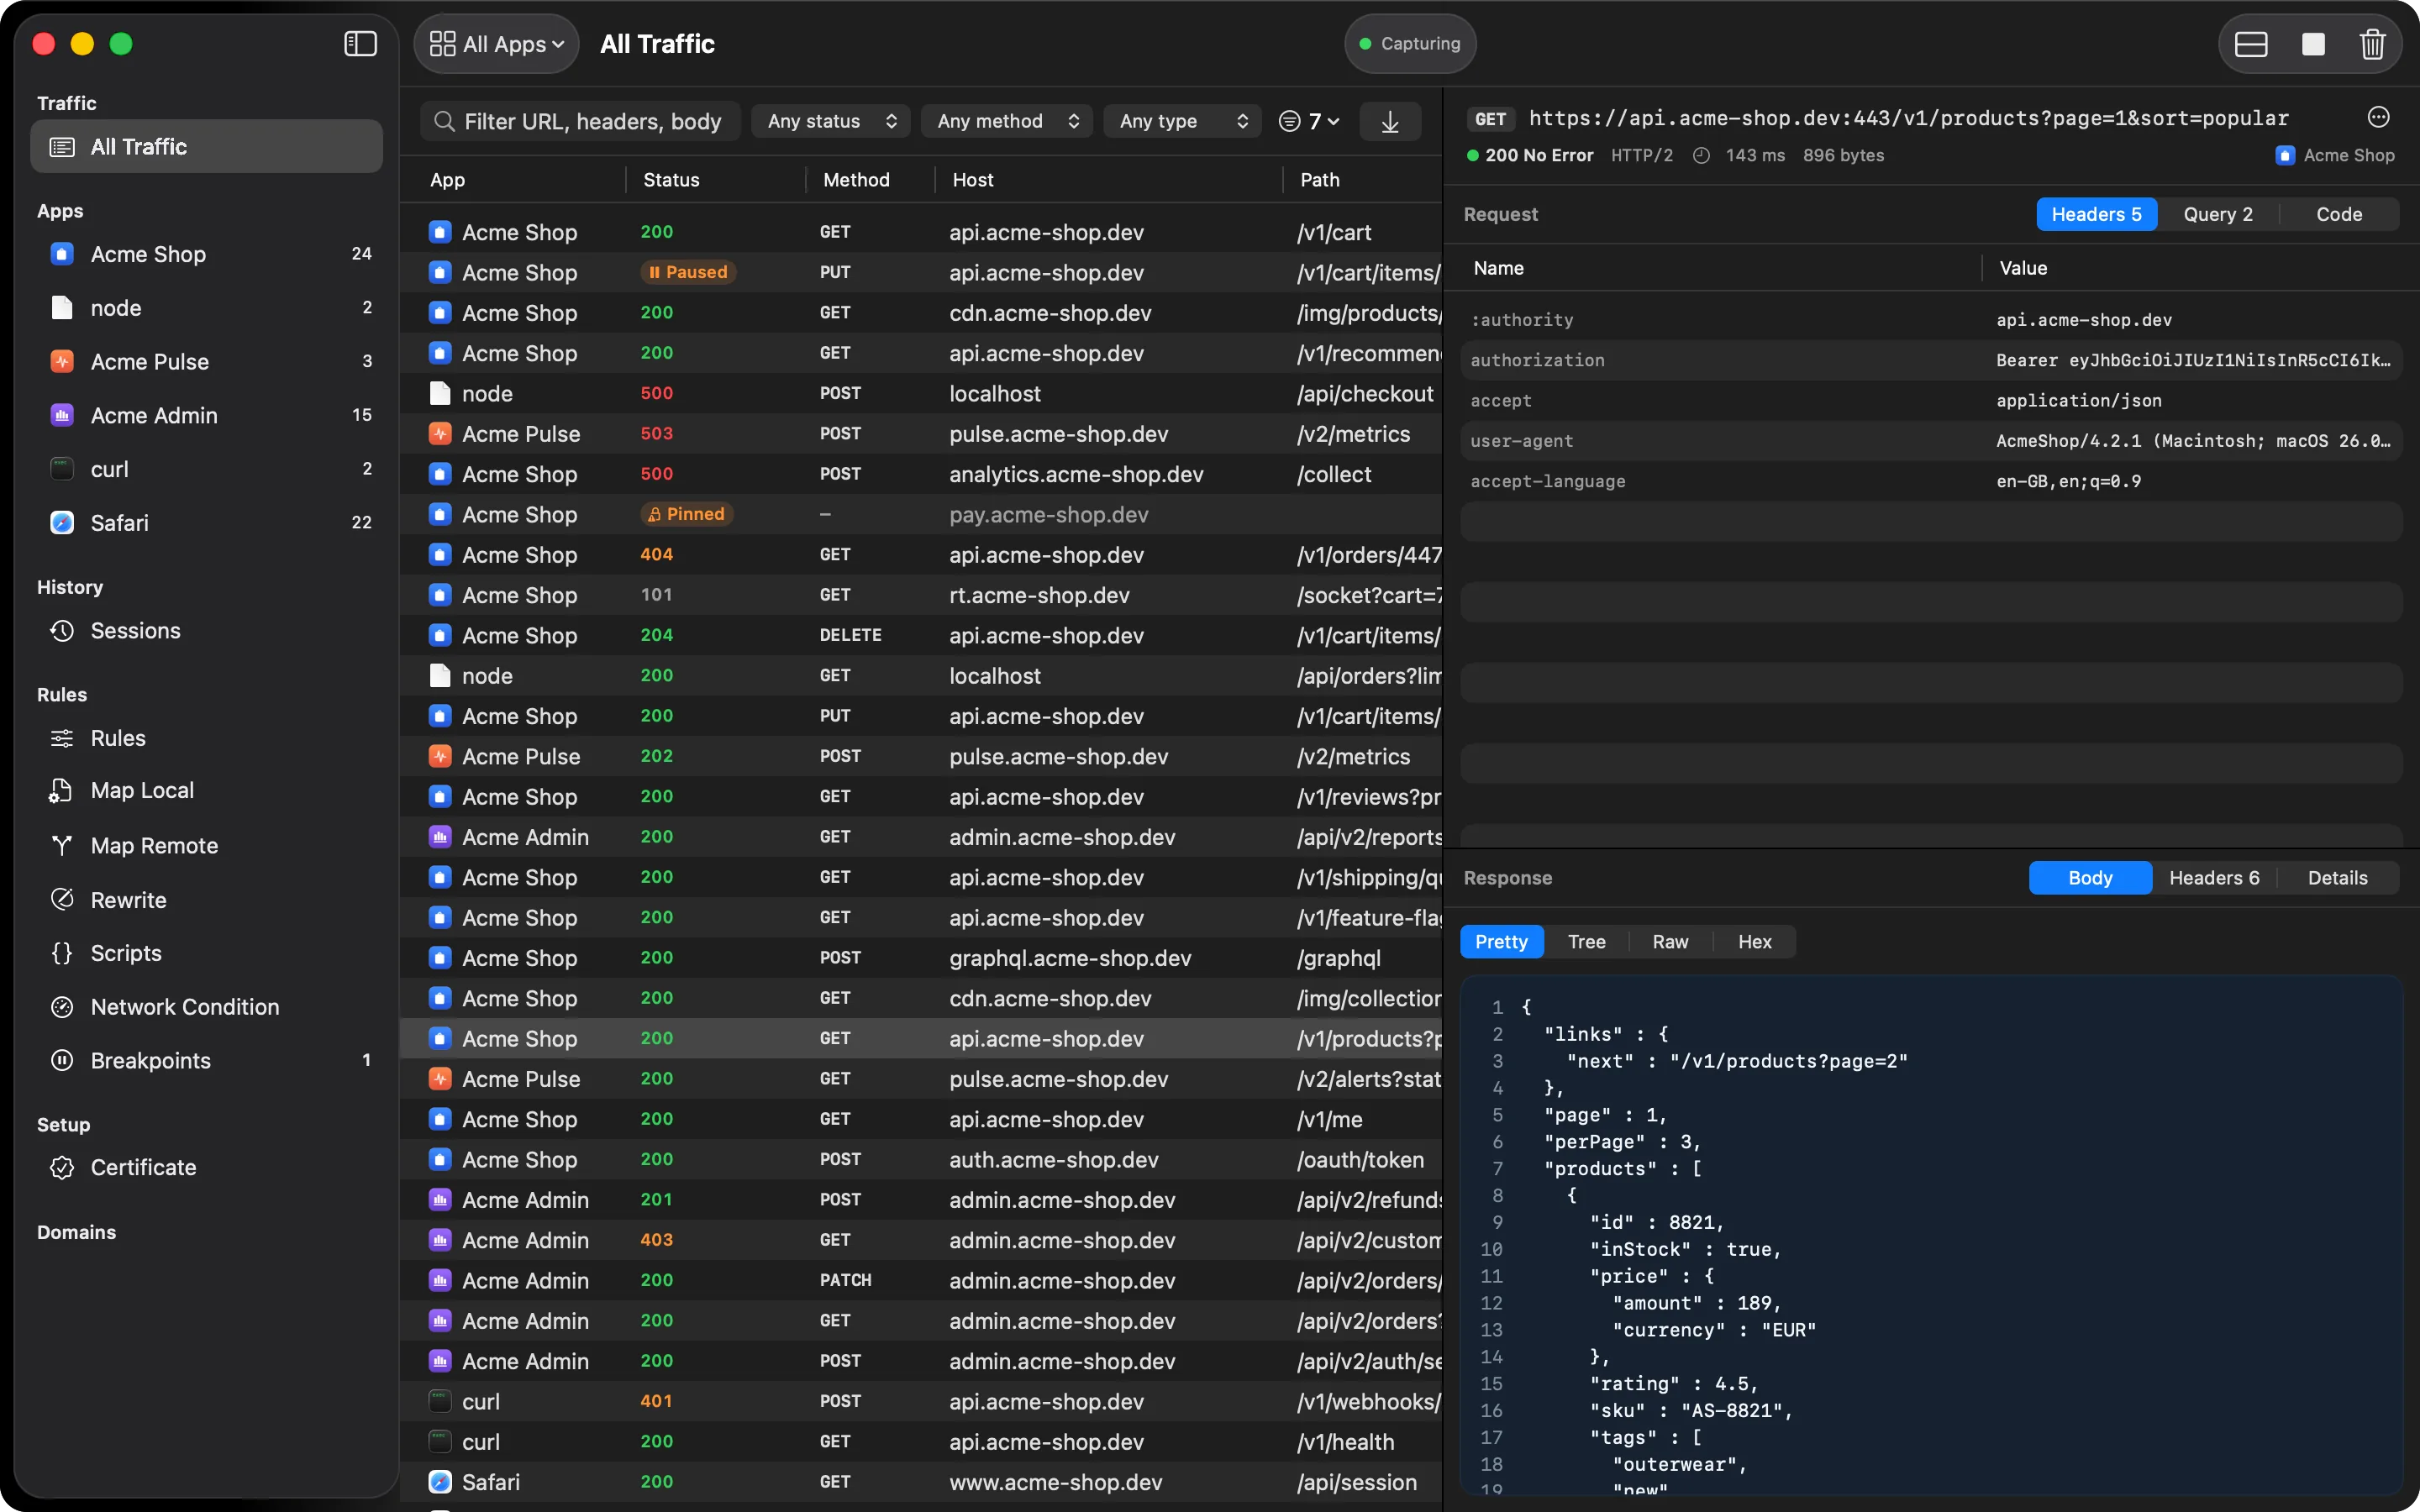
A Mac produces a lot of traffic: your own API calls, plus every open app’s telemetry, sync, and update checks. HTTPGlass gives you a few ways to cut through it, all in the filter bar above the traffic table.
Filters
- Status: any, errors, 4xx, or 5xx
- Method: GET, POST, PUT, PATCH, DELETE, HEAD, or OPTIONS
- Type: JSON, GraphQL, form, JS, CSS, image, document, and more
Filters stack, so “POST requests that returned a 5xx” is two menu picks.
Full-text search
The search field (⌘F) reaches into URLs, request and response headers, and text bodies. For large bodies, the first 256 KB is searchable. Search and filters work the same way whether you’re looking at all traffic, one app, or one domain.
The table
The table is a regular Mac table. Click a column header to sort it, and show or hide columns such as protocol, size, time, and start time. Requests that took longer than a second are tinted, so slow calls stand out. New rows scroll into view as they arrive until you select one, so the table doesn’t jump while you’re reading.
Sidebar views
Pick an app or a domain in the sidebar to see only its traffic. The Domains list shows a request count and an error count for each host, which is a quick way to see which service is failing or which SDK makes the most noise.
How it works
Everything runs from the filter bar above the table. Search (⌘F) matches URLs, request and response headers, and text bodies such as JSON, XML, HTML, forms, JavaScript, and plain text, on both the request and the response. The Status, Method, and Type menus narrow the rows without touching the search text. Follow, the arrow at the right end of the bar, keeps the newest row in view, and it switches itself off when you select a row.
The noise filter
On All Traffic, a noise filter hides two kinds of rows: HTTPS connections that weren’t decrypted, and macOS background services such as iCloud, Spotlight, and software update. Both are on by default. The number beside the button is how many rows are hidden, and clicking it switches either one off. The filter only applies to All Traffic. Select an app or a domain in the sidebar and you see all of its rows.
A typical debugging session
Your app misbehaves and the table is full. Pick the app in the sidebar, set Status to 5xx, and set Method to POST. Now only failing POSTs are left. Type part of a request field into search to find the one that carried it, then select the row to see the request and response side by side in the inspector. From the row’s menu you can copy the request as cURL or export it as a HAR file.
Related
- Inspector and body viewers show the selected row in detail
- Per-app capture explains picking the app you’re debugging
- Inspecting traffic covers the table, sidebar, and inspector in full
Also on iPhone & iPad:Get it on the App Store